
WORK CENTERS
How to use this PDS section: Work Centers are a section of PDS where home visitors, supervisors, and coordinators can see how their caseloads and programs are doing across different areas.
Why this information is important: Work Centers are an important tool to help home visitors, supervisors, and coordinators understand participant’s experience with HFM, monitor upcoming deadlines, and track follow-up needs.
HFM policies related to this PDS section: The program information and data shown in PDS Work Centers relates to many HFM policies. Some policies that are especially important to Work Centers:
I. Work Center Overview
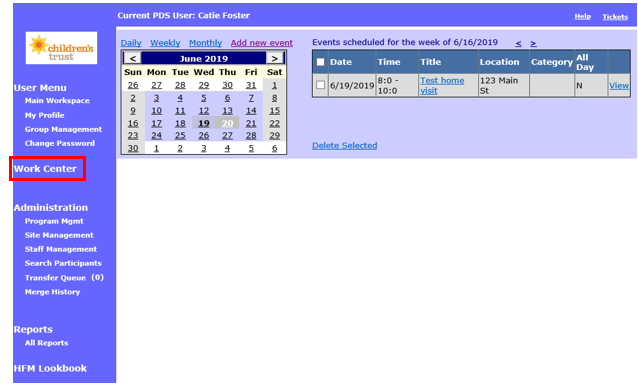
1. Click on Work Center on the left side of the Main Workspace.
2. On the main Work Center screen you will see a list of HFM staff and participants. What you see in this column depends on your role in HFM. The list of staff and participants is ordered based on the HFM supervision structure.
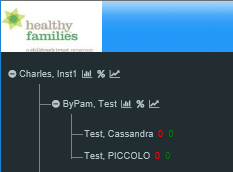
2.1 Coordinators see all supervisors assigned to them, the home visitors assigned to those supervisors, and the home visitors’ active caseloads. In the example below, Insti1Charles is the coordinator, Test ByPam is a supervisor, and Cassandra Test and PICCOLO Test are participants.
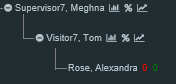
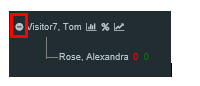
2.2 Supervisors see all home visitors assigned to them and those home visitors’ active case loads. In the example below, Meghna is a supervisor, Tom is a home visitor, and Alexandra Rose is in Tom’s caseload.
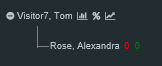
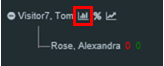
2.3 Home visitors see their active caseloads. In the screenshot below, Tom is a home visitor with Alexandra Rose is in his caseload.
3. To collapse or expand a section of the staff and participant list, click the minus or plus sign next to someone’s name.
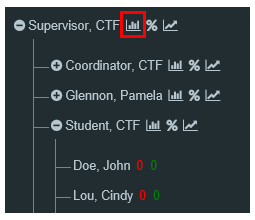
4. Click the icon that looks like a bar graph next to any staff member’s name to see his/her active case load’s work center.
II. Working with participant records
Viewing the participant snapshot page
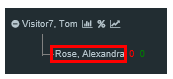
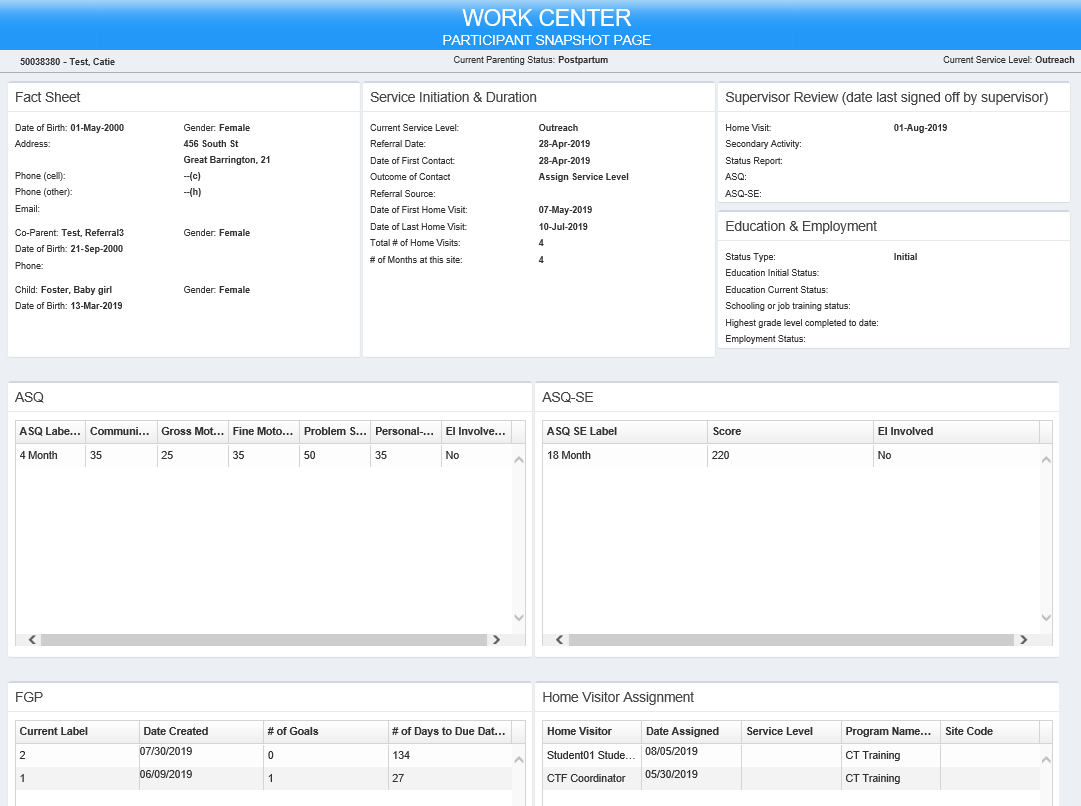
1. Click a participant’s name to see a summary of his/her demographic information, service history, education, employment, child’s ASQ scores, child’s ASQ-SE scores, FGP, home visitor assignment history, and supervisor review of records.
2. You cannot edit the information directly on the Participant Snapshot Page. Instead, go to the participant’s PDS profile to edit records. The information will be updated when you return to the Participant Snapshot Page
Viewing and reviewing records
Supervisors and Coordinators can monitor which records are ready for their review or re-review by looking at the numbers next to each participant’s name.
1. Green shows the number of records ready for supervisor review. A home visitor must check the Ready for Supervisor Review checkbox on the PDS record for it to appear in the Work Center as needing supervisor review.
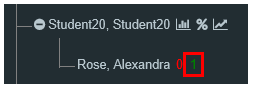
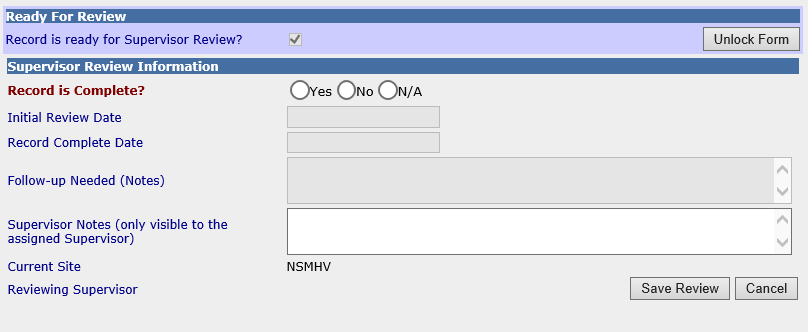
1.1 Below, Student20 has submitted one record for review. The supervisor must review the record and mark Yes, No, or N/A in for Record is Complete? in the “Supervisor Review Information” section of the record.
1.2 If the supervisor selected Yes or N/A, the record no longer appears in the Work Center as needing attention. If the supervisor selected No, the record remains in the work center as needing attention (see below).
2. Red shows the number of records that the supervisor has reviewed and marked No for Record is Complete? in the “Supervisor Review Information” section of the record. From the supervisor’s perspective, these are the records he or she is waiting to see resubmitted for review. When the record is re-marked for review. the record will appear in green.
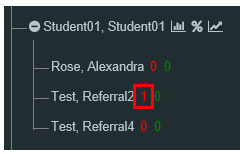
2.1 Below, Student01 submitted one of Referral2’s records for supervisor review. The supervisor reviewed it, marked it as incomplete, and made comments about what Student01 needed to edit in the record. Until Student01 re-submits the record for review, the record will appear in red in the Work Center.
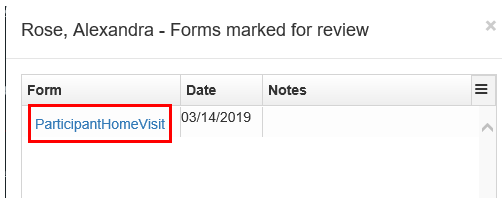
3. Click red or green numbers to display the records that have been marked for supervisor review.
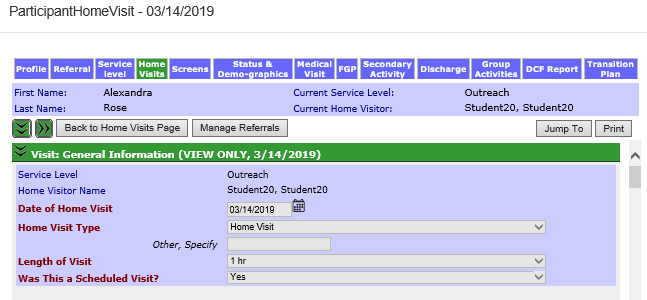
3.1 Select which record you want to review. When you click the link, you will not be taken to the actual home visit record but a copy of it with all of the existing details from the home visitor.
4. You can view or edit the record the way you usually would in PDS.
5. To make supervisor comments on a record, scroll to the Record Ready for Review section of the PDS record marked for review. See Introduction for Supervisors and Coordinators for instructions on using this section.
III. NavIgating GRaphs and Charts
Viewing graphs
The Work Center displays graphs and information about HFM activities. You can view these graphs and information by site, by supervisor, or by home visitor caseload. Program Coordinators also have access to site Performance Measures.
1. The graphs and information you see in the Work Center depends on the caseload you have selected in the staff list. For example, you can view the Work Center for a particular supervisor’s caseload or you can view the Work Center for an entire HFM site. What you can view depends on what PDS access rights you have.
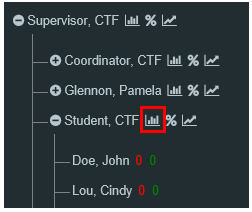
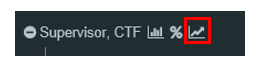
2. Click the small bar graph icon next to the name of the person whose caseload Work Center you want to view.
2.1 In the example below, CTF Supervisor is viewing the Work Center for all home visitors under her supervision because she clicked the bar graph icon next to her name.
2.2 In the example below, CTF Supervisor is viewing the Work Center for CTF Student, who is one home visitor under CTF Supervisor’s supervision. Therefore, the graphs and information CTF Supervisor sees in the Work Center do not include information from participants in other home visitors’ caseloads.
Graph views
1. Your Work Center will show four graphs of HFM activities on the main Work Center page. These graphs are based on what is in the PDS records and will change when you update or add records.
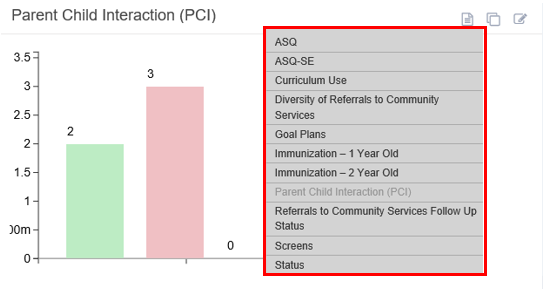
2.You can change which graphs appear on your Work Center by clicking the pencil and paper icon at the top of any graph.
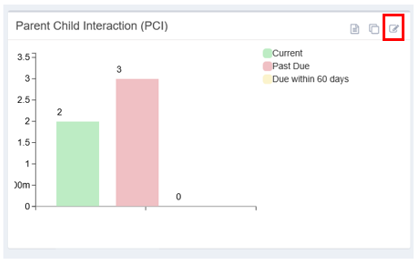
2.1 Select which graph you want to show. The graph you are already viewing will be grayed out on the list. In the example below, the PCI graph is shown on the Work Centers so it’s grayed out in the list.
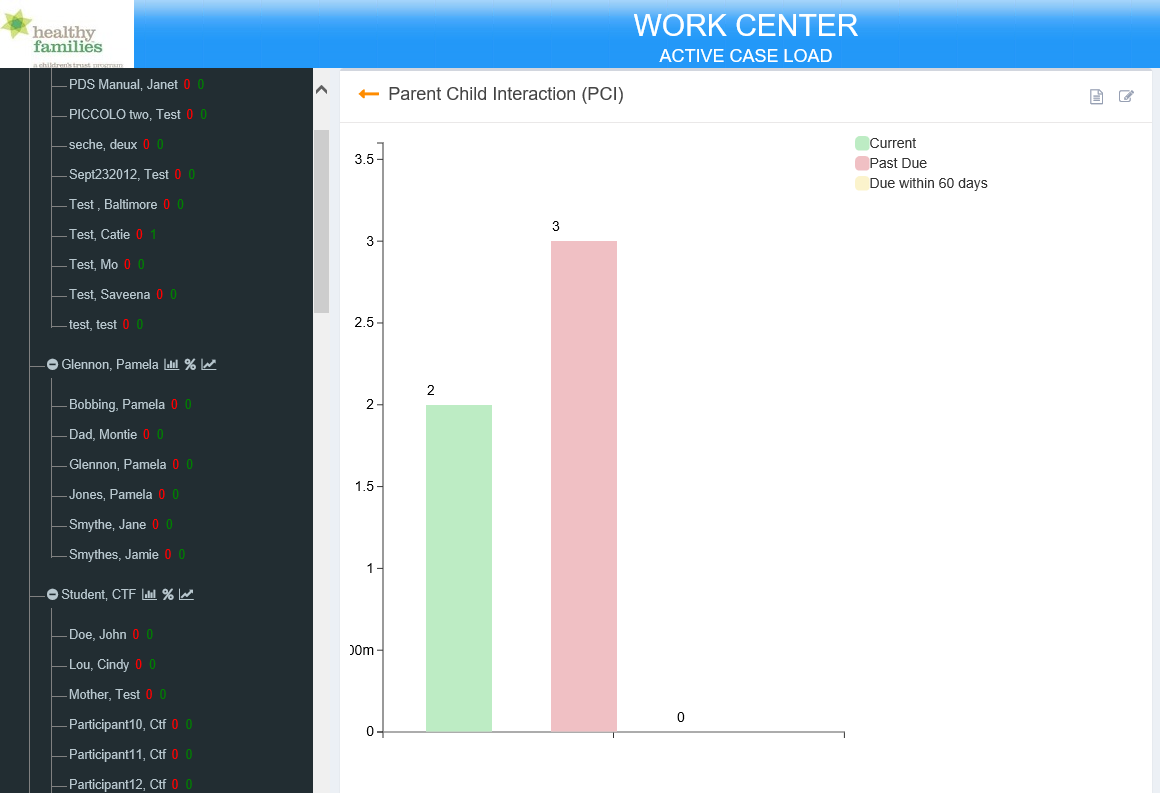
3. To view a larger version of any graph, click the icon that looks like two squares.
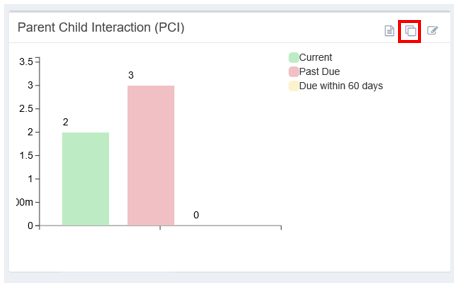
3.1 The graph will take up the entire screen.
4. To view the individual records that make up the graph, click the icon that looks like a piece of paper.
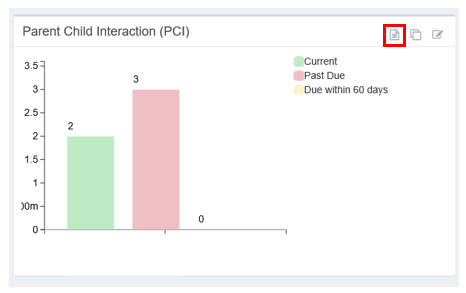
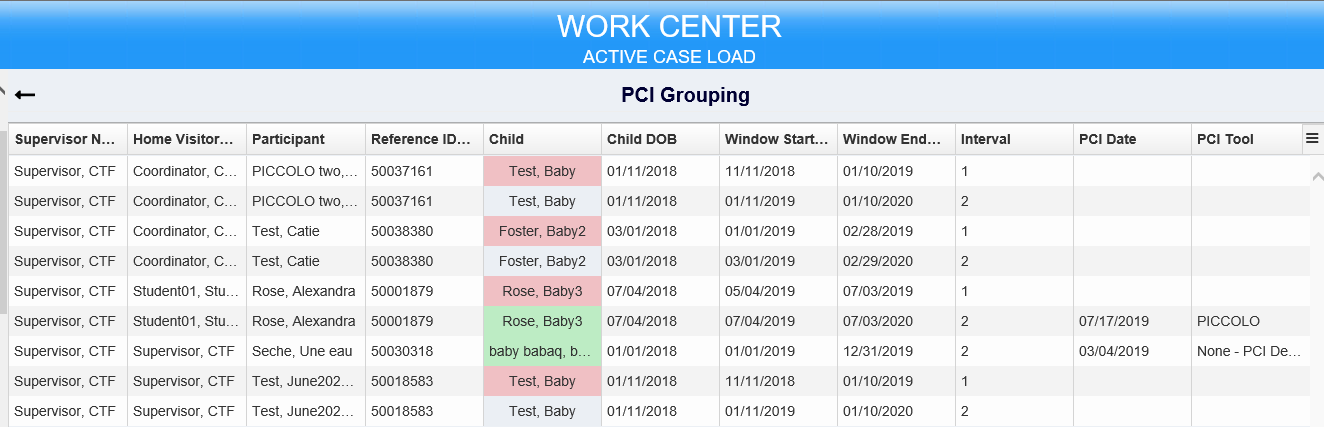
4.1 In the example below, the user is looking at participant records for PCI tools used at her site.
4.2 You can also click one category in the graph to see the individual records that make up a specific category.
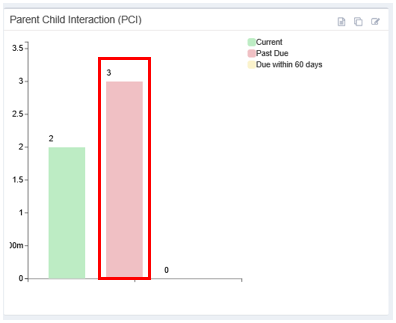
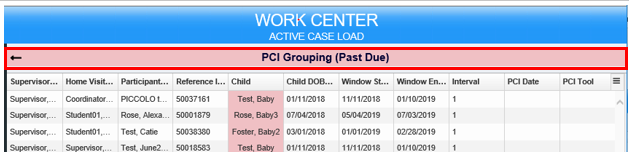
4.3 In the example below, the user is looking at PCI records that are past due (pink category).
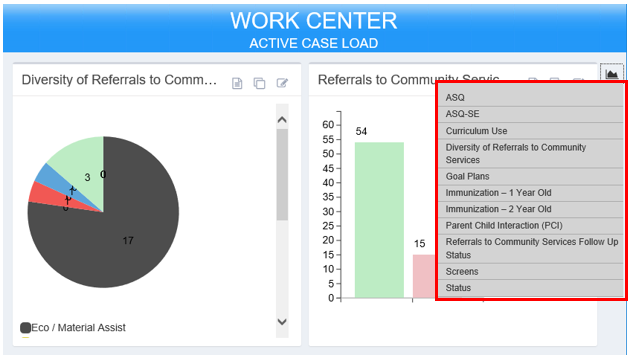
5. To jump to a particular graph from the main Work Center, click the small graph icon at the top right of the screen.
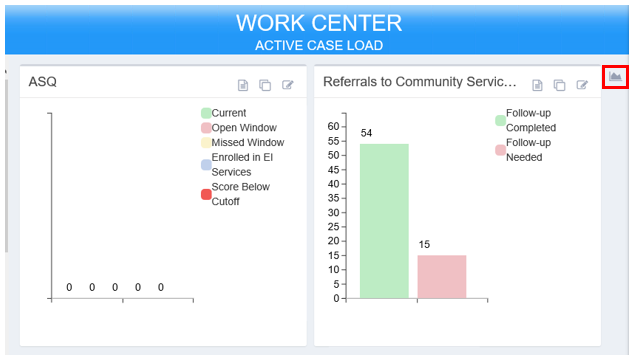
5.1 Select which graph you want to view.
Individual records in Work Centers graphs
1. Each graph is based on PDS records. You can see more details about each graph by looking at the individual records for that output.
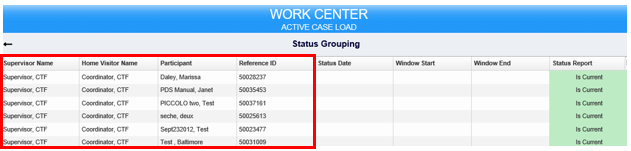
2. For graphs that show information by participant, each records table shows the supervisor’s name, home visitor’s name, participant’s name, and participant’s reference. The remaining display based on the information in the graph.
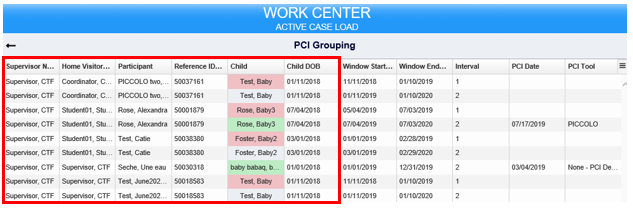
3. For graphs that show information by child, each records table shows the supervisor’s name, home visitor’s name, participant’s name, participant’s reference ID, child’s name, and child’s DOB.
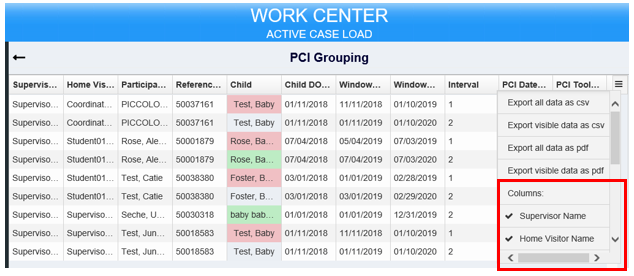
4. You can hide or show columns in any records table. Click the icon with three lines at the top right of the records table. 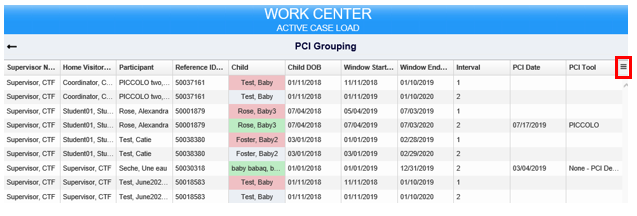
4.1 Select and un-select columns by clicking the name of the column title in the list. Column names with a check mark will appear in the table. Column with an X are hidden and do not appear in the table. Hiding a column does not delete any data from PDS. This feature may be helpful if you want to limit the amount of information you see in the table at one time.
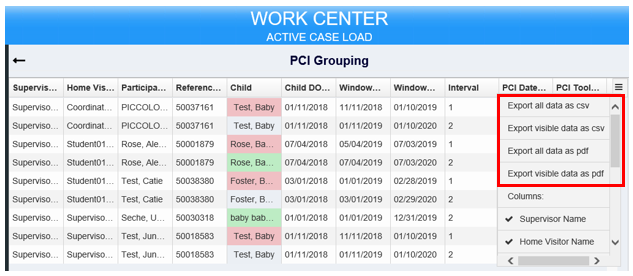
5. You can also download records from the table into another file.
5.1 After clicking the icon with the three lines at the top right corner, click Export all data as csv or Export all data as pdf to download all the records including hidden columns. Click Export visible data as csv or Export visible data as pdf to download all records excluding hidden columns. You can open a csv file in Microsoft Excel.
IV. Criteria of Active Caseload Graphs
The graphs that display under active caseload are different from those in the HFM Performance Measures. These graphics only show information for participants that are currently active at the program. These displays are to help guide staff in service delivery needs of families. PDS Active Caseload Work Centers display graphs of the following information:
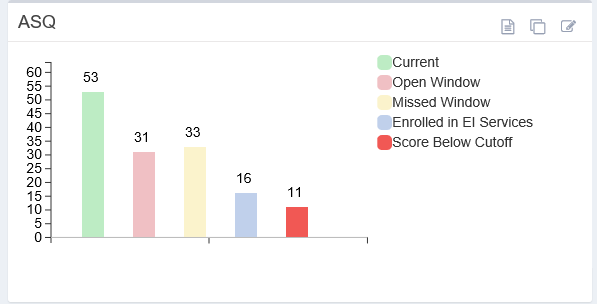
ASQ
1. Data: This graph is based on child ASQ screening data.
2. Display: Children may appear more than once in this graph if they have past or current ASQ screenings that met the criteria for more than one of the categories below. For example, a child who missed their last ASQ window and scored above the cut-off in their current ASQ window would appear once in the yellow category and once in the green category.
3. Exclusions: This graph does not include children of participants without at least one status record in PDS.
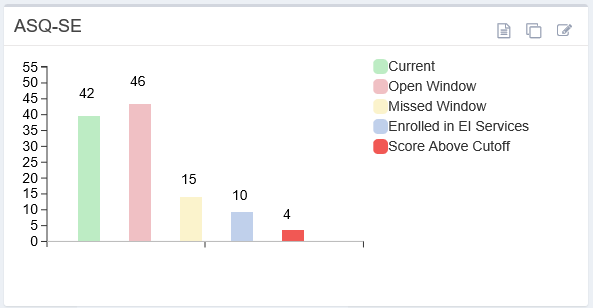
ASQ-SE
1. Data: This graph is based on child ASQ-SE screening data.
2. Display: Children may appear more than once in this graph if they have past or current ASQ-SE screenings that met the criteria for more than one of the categories below. For example, a child who missed their last ASQ-SE window and scored below the cut-off in their current ASQ:SE window would appear once in the yellow category and once in the green category.
3. Exclusions: This graph does not include children of participants without at least one status record in PDS.
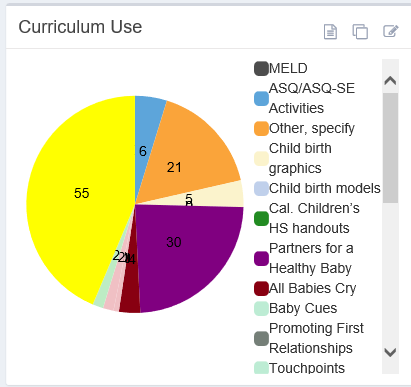
Curriculum Use
1. Data: This graph is based on home visit records.
2. Display: Each time a home visitor selects a curriculum used during a home visit, the curriculum is counted once in this graph. For example, if you recorded using MELD during three separate home visits, it will be counted three times on this graph.
3. Exclusions: Only Home Visits done while the participant was on the home visitor’s caseload are counted.
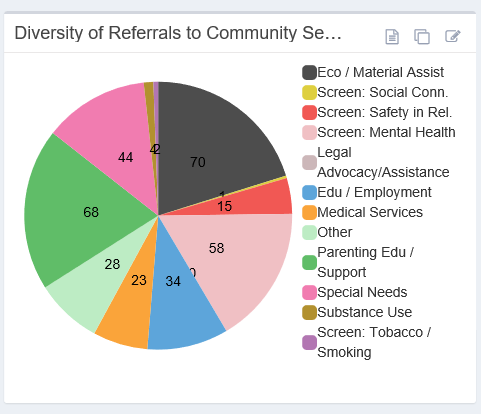
Diversity of Referrals to Community Services:
1. Data: This graph is based on referrals recorded in home visit records.
2. Display: Each time a home visitor documents a referral offer, the referral is counted once in this graph. For example, if you referred a participant to EI services during three separate home visits, EI will be counted three times on this graph.
3. Exclusions: Only Home Visits done while the participant was on the home visitor’s caseload are counted.
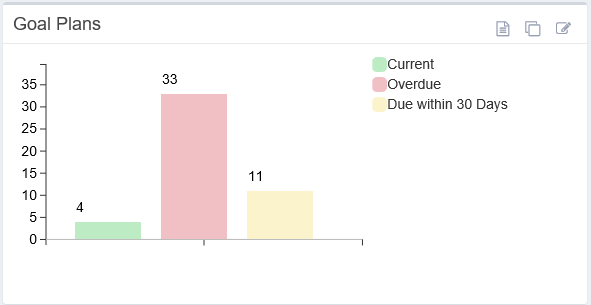
Goal Plans
1. Data: This graph is based on participants’ FGP data.
2. Display: Each participant appears once in the graph.
3. Exclusions: the first FGP is due 60 days after the first home visit. Participants do not appear in this graph until 30 days have passed since their first home visit (which would put them in the yellow category until an initial FGP is created).
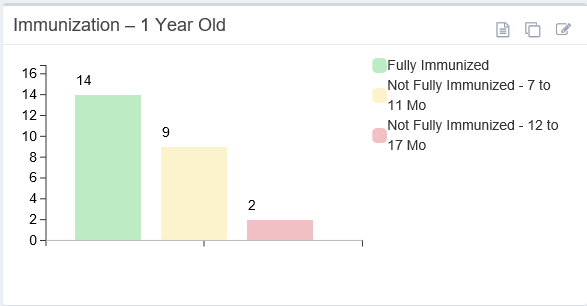
Immunization – 1 Year Old
1. Data: This graph is based on immunizations recorded in Child Medical Visit records.
2. Display: Each child appears once in the graph.
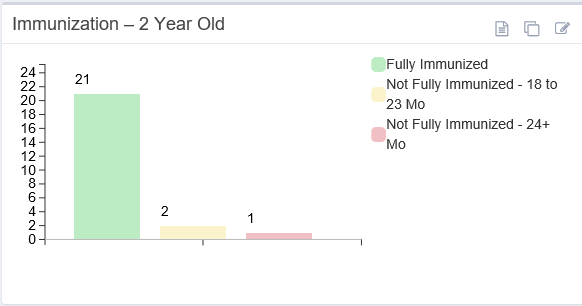
Immunization – 2 Year Old
1. Data: This graph is based on immunizations recorded in Child Medical Visit records.
2. Display: Each child appears once in the graph.
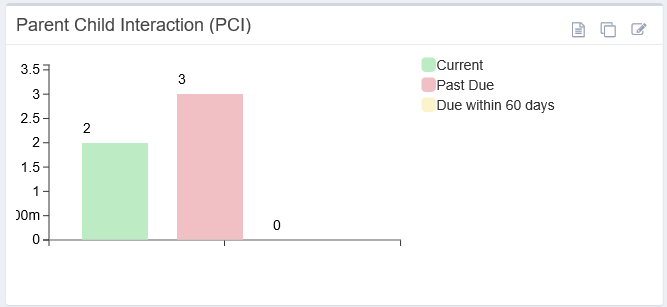
Parent Child Interaction (PCI)
1. Data: This data comes from PCI records.
2. Display: Children may appear more than once on each graph if they have missed a past PCI window and are in a current PCI window.
3. Exclusions: Children with optional PCI windows are not included in the graph.
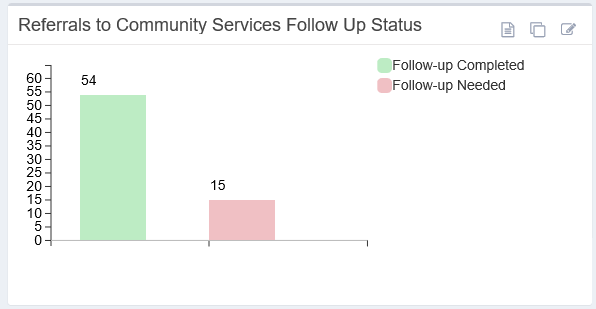
Referrals to Community Services Follow Up Status:
1. Data: This data comes from referral records.
2. Display: Participants appear once in the graph. If a participant has multiple referrals needing follow-up, he/she counts only once.
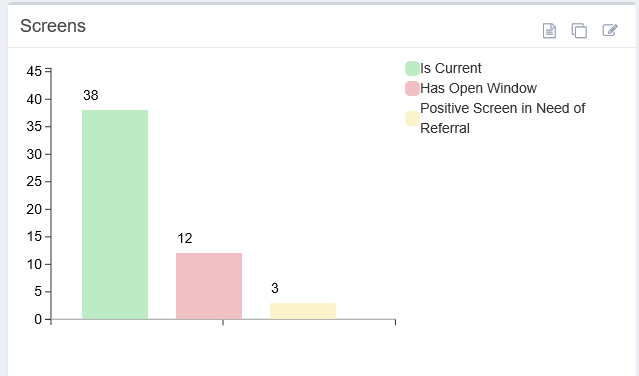
Screens: Based on the participant’s screening records
1. Data: This graph is based on the results of participant Mental Health and Safety screens.
2. Display: Each participant appears once in the graph.
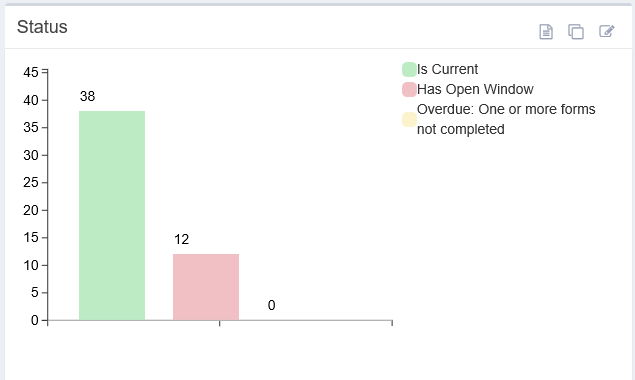
Status
1. Data: This graph is based on the participant’s status records.
2. Display: Each participant appears once in the graph.
V. Program-wide performance MEasures
1. The Work Centers also show progress toward program-wide performance measures. These measures are only available to those with Coordinator rights in PDS.
2. Each performance measure data point appears in a bar graph with color-coding as follows:
3. As with other graphs in the Work Center, you can view performance measures at different caseload levels (e.g. program-wide vs. a specific supervisor). Make sure you have selected the correct performance measure view when you are monitoring progress in Work Center.
VI. program performance: Outcomes
Click the percentage symbol icon to view performance measure outcomes.

Below is a description of each performance measure outcome, including what records are included/excluded from the measure and how the measure is calculated.
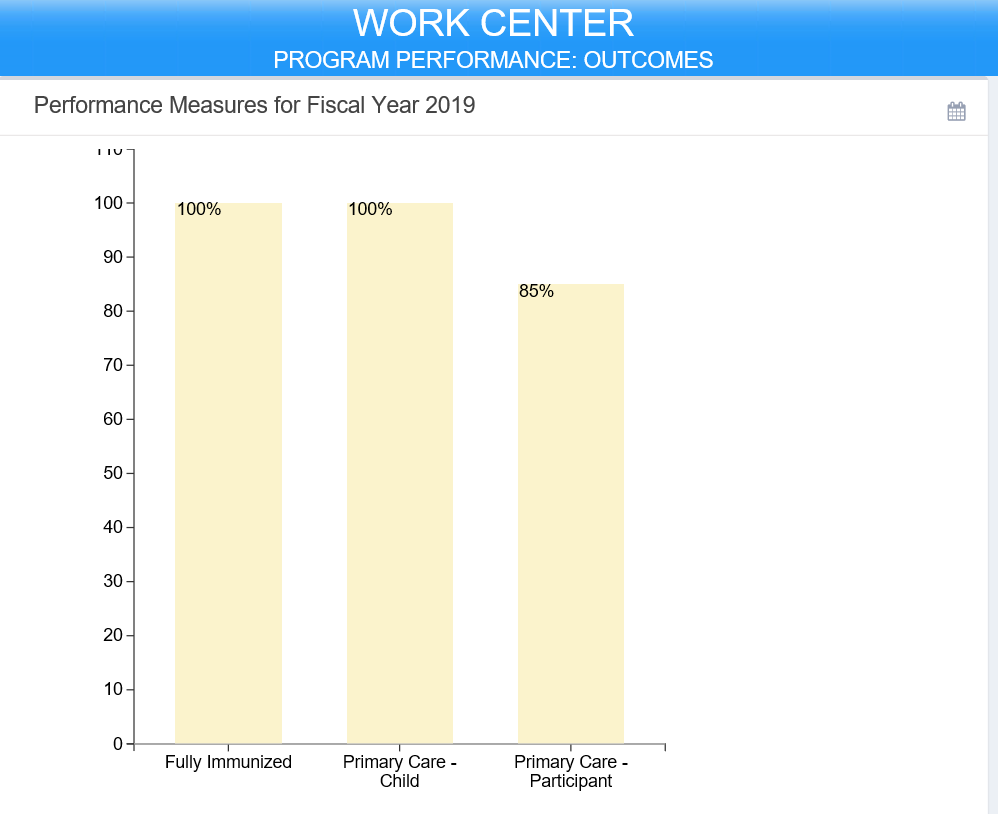
Child Primary Care (Goal: 100%)
1. Selection criteria:
Any participant with the outcome of contact of Assign Service Level, Transfer or Re-enroll, and with the referral day that is greater than the last day of the previous fiscal year and less than the first day of the next fiscal year. For example, for FY19 this performance measure includes participants with a referral date is greater than 6/30/2018 and less than 7/1/2019 (this pulls active/inactive participants during the current fiscal year).
OR
Any participant with a discharge record with a discharge date that is greater than the last day of the previous fiscal year and less than the first day of the next fiscal year. For example, for FY19 this performance measure includes participants with a referral date is greater than 6/30/2018 and less than 7/1/2019 (this pulls partially active/inactive during the current fiscal year).
2. Exclusions: Any participant with no child status records.
3. Calculation (as a percent):
Primary Care – Participant (Goal: 85%)
1. Selection criteria:
Any participant with the outcome of contact of Assign Service Level, Transfer or Re-enroll, and with the referral day that is greater than the last day of the previous fiscal year and less than the first day of the next fiscal year. For example, for FY19 this performance measure includes participants with a referral date is greater than 6/30/2018 and less than 7/1/2019 (this pulls active/inactive participants during the current fiscal year).
OR
Any participant with a discharge record with a discharge date that is greater than the last day of the previous fiscal year and less than the first day of the next fiscal year. For example, for FY19 this performance measure includes participants with a referral date is greater than 6/30/2018 and less than 7/1/2019 (this pulls partially active/inactive during the current fiscal year).
2. Exclusion criteria: Any participant with no status records.
3. Calculation (as a percent):
Fully immunized (Goal: 100%)
1. Selection criteria:
Any participant with the outcome of contact of Assign Service Level, Transfer or Re-enroll, and with the referral day that is greater than the last day of the previous fiscal year and less than the first day of the next fiscal year. For example, for FY19 this performance measure includes participants with a referral date is greater than 6/30/2018 and less than 7/1/2019 (this pulls active/inactive participants during the current fiscal year).
OR
Any participant with a discharge record with a discharge date that is greater than the last day of the previous fiscal year and less than the first day of the next fiscal year. For example, for FY19 this performance measure includes participants with a referral date is greater than 6/30/2018 and less than 7/1/2019 (this pulls partially active/inactive during the current fiscal year).
2. Exclusion criteria: Any participant with no status records.
3. Calculation (as a percent):
VII. Performance Measure Outputs
Click the upwards arrow icon to view performance measure outputs.
Below is a description of each performance measure output, including what records are included/excluded from the measure and how the measure is calculated.
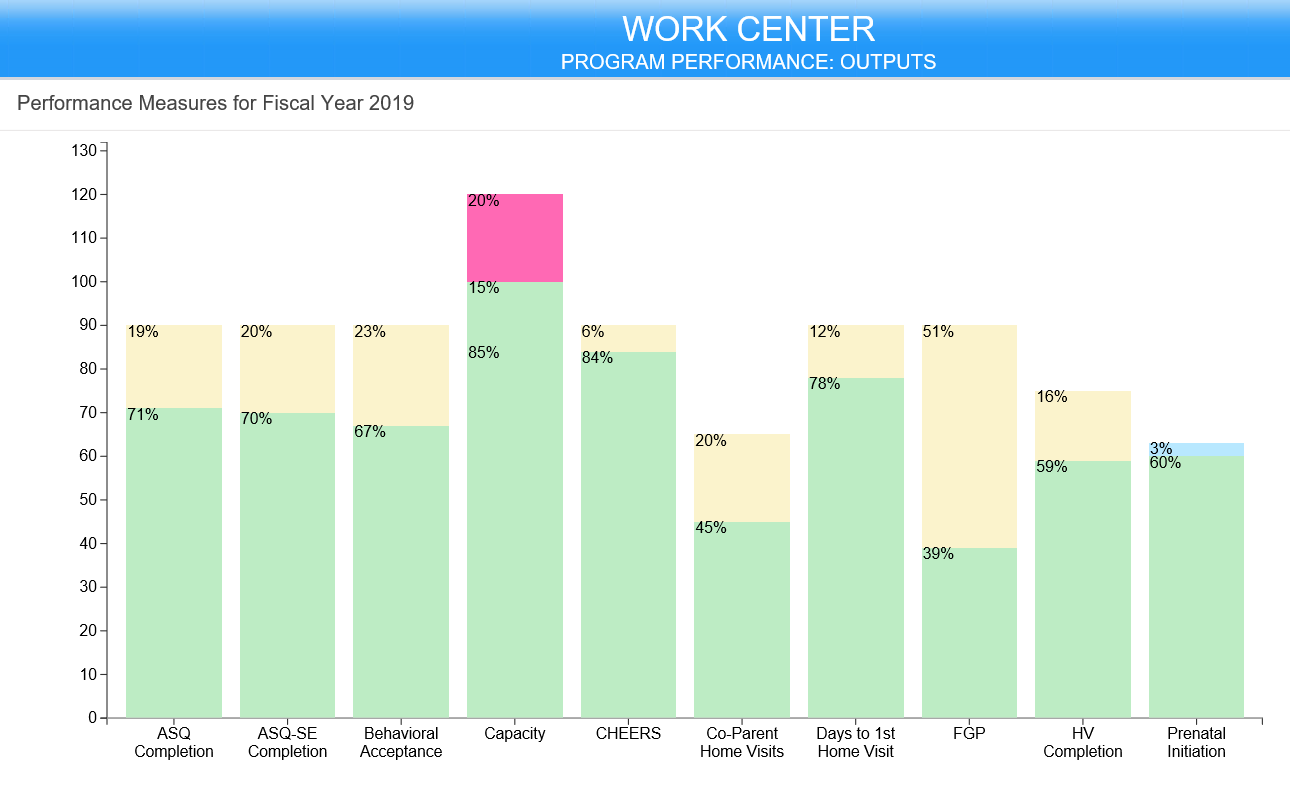
ASQ Completion (Goal: 90%)
1. Selection criteria:
Any participant with the outcome of contact of Assign Service Level, Transfer or Re-enroll, and with the referral day that is greater than the last day of the previous fiscal year and less than the first day of the next fiscal year. For example, for FY19 this performance measure includes participants with a referral date is greater than 6/30/2018 and less than 7/1/2019 (this pulls active/inactive participants during the current fiscal year).
OR
Any participant with a discharge record with a discharge date that is greater than the last day of the previous fiscal year and less than the first day of the next fiscal year. For example, for FY19 this performance measure includes participants with a referral date is greater than 6/30/2018 and less than 7/1/2019 (this pulls partially active/inactive during the current fiscal year).
2. Exclusion criteria: Any participant with no status records.
3. Calculation (as a percent):
ASQ-SE Completion (Goal: 90%)
1. Selection criteria:
Any participant with the outcome of contact of Assign Service Level, Transfer or Re-enroll, and with the referral day that is greater than the last day of the previous fiscal year and less than the first day of the next fiscal year. For example, for FY19 this performance measure includes participants with a referral date is greater than 6/30/2018 and less than 7/1/2019 (this pulls active/inactive participants during the current fiscal year).
OR
Any participant with a discharge record with a discharge date that is greater than the last day of the previous fiscal year and less than the first day of the next fiscal year. For example, for FY19 this performance measure includes participants with a referral date is greater than 6/30/2018 and less than 7/1/2019 (this pulls partially active/inactive during the current fiscal year).
2. Exclusion criteria: Any participant with no status records.
3. Calculation (as a percent):
Behavioral Acceptance (Goal: 90%)
1. Selection criteria:
Any participant with the outcome of contact of Assign Service Level, Transfer, Re-enroll, or Declined All Services and with the referral day that is greater than the last day of the previous fiscal year and less than the first day of the next fiscal year. For example, for FY19 this performance measure includes participants with a referral date is greater than 6/30/2018 and less than 7/1/2019 (this pulls active/inactive participants during the current fiscal year).
OR
Any participant with a discharge record with a discharge date that is greater than the last day of the previous fiscal year and less than the first day of the next fiscal year. For example, for FY19 this performance measure includes participants with a referral date is greater than 6/30/2018 and less than 7/1/2019 (this pulls partially active/inactive during the current fiscal year).
2. Exclusion criteria: None
3. Calculation (as a percent):
Capacity (Goals between 85% and 100%)
1. Selection criteria:
Any participant with the outcome of contact of Assign Service Level, Transfer or Re-enroll, and with the referral day that is greater than the last day of the previous fiscal year and less than the first day of the next fiscal year. For example, for FY19 this performance measure includes participants with a referral date is greater than 6/30/2018 and less than 7/1/2019 (this pulls active/inactive participants during the current fiscal year).
OR
Any participant with a discharge record with a discharge date that is greater than the last day of the previous fiscal year and less than the first day of the next fiscal year. For example, for FY19 this performance measure includes participants with a referral date is greater than 6/30/2018 and less than 7/1/2019 (this pulls partially active/inactive during the current fiscal year).
2. Exclusion criteria: Any participant with no home visit records.
3. Calculation (as a percent):
Note: For this graph, the bar is green for capacity reaching up to 85% and for the section between 85% to 100%. The bar is pink for anything beyond 100%.
CHEERS (Goal 90%)
Any participant with the outcome of contact of Assign Service Level, Transfer or Re-enroll, and with the referral day that is greater than the last day of the previous fiscal year and less than the first day of the next fiscal year. For example, for FY19 this performance measure includes participants with a referral date is greater than 6/30/2018 and less than 7/1/2019 (this pulls active/inactive participants during the current fiscal year).
OR
Any participant with a discharge record with a discharge date that is greater than the last day of the previous fiscal year and less than the first day of the next fiscal year. For example, for FY19 this performance measure includes participants with a referral date is greater than 6/30/2018 and less than 7/1/2019 (this pulls partially active/inactive during the current fiscal year).
Co-Parent Visits (Goal 65%)
Any participant with the outcome of contact of Assign Service Level, Transfer or Re-enroll, and with the referral day that is greater than the last day of the previous fiscal year and less than the first day of the next fiscal year. For example, for FY19 this performance measure includes participants with a referral date is greater than 6/30/2018 and less than 7/1/2019 (this pulls active/inactive participants during the current fiscal year).
OR
Any participant with a discharge record with a discharge date that is greater than the last day of the previous fiscal year and less than the first day of the next fiscal year. For example, for FY19 this performance measure includes participants with a referral date is greater than 6/30/2018 and less than 7/1/2019 (this pulls partially active/inactive during the current fiscal year).
Days to First Home Visit (Goal 90%)
Any participant with the outcome of contact of Assign Service Level, Transfer or Re-enroll, and with the referral day that is greater than the last day of the previous fiscal year and less than the first day of the next fiscal year. For example, for FY19 this performance measure includes participants with a referral date is greater than 6/30/2018 and less than 7/1/2019 (this pulls active/inactive participants during the current fiscal year).
OR
Any participant with a discharge record with a discharge date that is greater than the last day of the previous fiscal year and less than the first day of the next fiscal year. For example, for FY19 this performance measure includes participants with a referral date is greater than 6/30/2018 and less than 7/1/2019 (this pulls partially active/inactive during the current fiscal year).
FGP (Goal: 90%)
1. Selection criteria:
Any participant with the outcome of contact of Assign Service Level, Transfer or Re-enroll, and with the referral day that is greater than the last day of the previous fiscal year and less than the first day of the next fiscal year. For example, for FY19 this performance measure includes participants with a referral date is greater than 6/30/2018 and less than 7/1/2019 (this pulls active/inactive participants during the current fiscal year).
OR
Any participant with a discharge record with a discharge date that is greater than the last day of the previous fiscal year and less than the first day of the next fiscal year. For example, for FY19 this performance measure includes participants with a referral date is greater than 6/30/2018 and less than 7/1/2019 (this pulls partially active/inactive during the current fiscal year).
2. Exclusion criteria: Any participant with no home visit records.
3. Calculation (as a percent):
HV Completion (Goal: 75%)
1. Selection criteria:
Any participant with the outcome of contact of Assign Service Level, Transfer or Re-enroll, and with the referral day that is greater than the last day of the previous fiscal year and less than the first day of the next fiscal year. For example, for FY19 this performance measure includes participants with a referral date is greater than 6/30/2018 and less than 7/1/2019 (this pulls active/inactive participants during the current fiscal year).
OR
Any participant with a discharge record with a discharge date that is greater than the last day of the previous fiscal year and less than the first day of the next fiscal year. For example, for FY19 this performance measure includes participants with a referral date is greater than 6/30/2018 and less than 7/1/2019 (this pulls partially active/inactive during the current fiscal year).
2. Exclusion criteria: None.
3. Calculation (as a percent):
Below are required visits per service level:
Prenatal Initiation (Goal: 60%)
1. Selection criteria:
Any participant with the outcome of contact of Assign Service Level, Transfer or Re-enroll, and with the referral day that is greater than the last day of the previous fiscal year and less than the first day of the next fiscal year. For example, for FY19 this performance measure includes participants with a referral date is greater than 6/30/2018 and less than 7/1/2019 (this pulls active/inactive participants during the current fiscal year).
OR
Any participant with a discharge record with a discharge date that is greater than the last day of the previous fiscal year and less than the first day of the next fiscal year. For example, for FY19 this performance measure includes participants with a referral date is greater than 6/30/2018 and less than 7/1/2019 (this pulls partially active/inactive during the current fiscal year).
2. Exclusion criteria: Any participant with an outcome of contact of Transfer or Re-enroll and who have no home visits.
3. Calculation (as a percent)
Work Centers (Sept 2019)
©2019 MA Children's Trust